Results of the 2020 ICESat-2 Cryospheric Hackweek icepyx survey
At the end of the June 2020 Hackweek, the icepyx project team asked participants to fill out a short survey about their experiences so far with icepyx and what features they’d like to see next. Here are the results of that survey, with a few comments in response at the end.
Question 1: Ranked order for most desired new features (determined based on a weighted point total, where each first-choice vote got 6 points, each second choice vote got 5 points, etc.)
- Data visualization before download
- Data reading/ingest
- Data visualization after download
- Data extraction based on variable value (e.g. extract data based on quality flag)
- Access to other datasets (e.g. DEM products)
- Access to cloud compatible formatted data
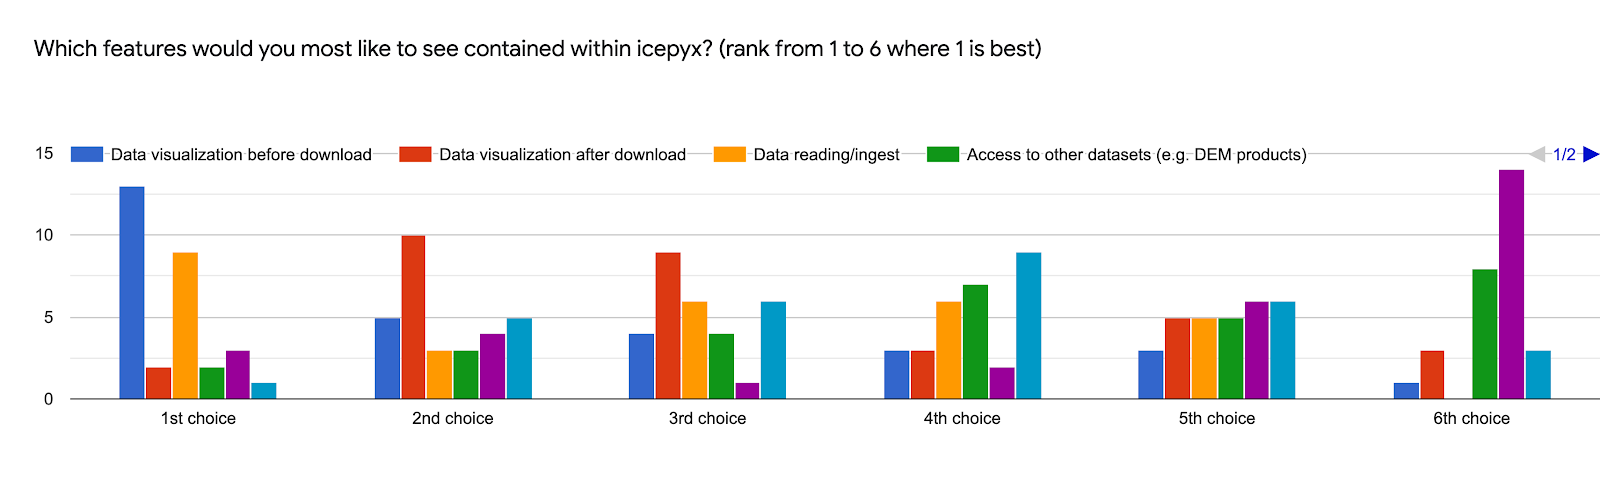
Note: The last two legend items are “Access to cloud compatible formatted data” (purple) and “Data extraction based on variable value” (blue). If you’re having trouble viewing this data due to Google Form’s built-in color scheme, please contact me and I’d be happy to share the data with you another way. The bar-graph colors are presented in the same order as the legend.
Question 2: Biggest Roadblock to Contributing Code

Question 3: Data Format to work in

Question 4: Summary of biggest Challenges in finding/accessing ICESat-2 data?
18 people (of 30 survey takers) responded to this question.
Responses varied widely, but a few common themes were:
- Difficulty understanding and navigating the large, complex datasets (before and after download), particularly for new users.
- Not sure what the best place to go for information and help is.
Several noted that the tools presented at the Hackweek and available through NSIDC had helped them address many of the challenges they were facing (yay!)
Question 5: Summary of biggest Challenges in using icepyx?
17 people (of 30 survey takers) responded to this question.
The responses tended to fall into one of two categories. For those already comfortable with Python, icepyx as it stood was commended and the desire for more features expressed (one of which, having saved login information for Earthdata, has already been implemented!). For those newer to Python and setting up a Python environment, the primary challenges stemmed from local installation and being new to this type of work.
A few responses suggested a need for clearer pointers to documentation (e.g. to show function availability) and examples of use/code for new users/developers.
Question 6: If you could have one feature implemented in icepyx immediately, what would it be?
17 people (of 30 survey takers) responded to this question.
This section contained lots of great ideas, several of which are now in the works. The majority of responses concerned better ways to visualize (and manage) data, particularly before order/download. Other ideas targeted cloud-computing compatibility, more options for subsetting (such as by RGT or cycle), and multiple sensor data access and intercomparisons.
Some comments on these survey results:
These responses provide a great roadmap for where icepyx should focus on development next (thanks to all those who took the time to fill it out. If you haven’t responded yet, the survey is still open at: https://forms.gle/2FM3Nh1YFBz25JHw8). There is a clear need for visualization throughout the data query and analysis process, and we’re delighted to share that efforts are already underway to generalize the work of the Assimilation project group to provide simple visualizations of available data prior to ordering/download using the OpenAltimetry API. Further, the leading_to_phytoplankton project group has decided to join the icepyx development team to incorporate and expand on their work to easily query and visualize multiple oceanography datasets along with ICESat-2 data.
In addition to these upcoming feature developments, we are working to expand and improve our examples and resources to enable better data discovery, understanding, and use (the ICESat-2 datasets are large and complex!) as well as help new coders feel more comfortable contributing their code. As cryospheric scientists, many of us write code to get and analyze data, but we are seldom taught HOW to write code. This includes coding collaboratively, version control (e.g. git), and contributing to open-source software. One of icepyx’s core aims is to help bridge this gap by providing resources and support to help researchers effectively share their code, thereby maximizing their contributions to the research community and providing them formal recognition for this time-consuming part of research that is often summarized in a few sentences of methods.