Computing the El Niño index from ERA5 with SQL

Sharing a small experiment that might interest folks here. I computed the full Oceanic Niño Index (ONI) — every overlapping 3-month season from 1950 to today — as a single SQL query running in place against ARCO-ERA5 on GCS, using zarr-datafusion (GitHub - jayendra13/zarr-datafusion: Extending DataFusion to do SQL queries on Zarr data. · GitHub) (a DataFusion-based SQL engine for Zarr).

The query does the whole pipeline declaratively: sample the Niño-3.4 box, build monthly SST anomalies against NOAA’s centred rolling 30-year climatology, take the 3-month running mean, and classify the ENSO phase — streaming only the chunks it touches, with no local copy of the dataset.

To check it’s actually right, I compared all 916 seasons against NOAA CPC’s official (ERSSTv5-based) table: MAE 0.17 °C (0.12 °C post-1979), Pearson r = 0.966, and zero sign reversals in phase classification. The residuals behave as you’d expect — larger in the pre-satellite era, shrinking toward the present.

One caveat worth flagging: the monthly value isn’t a true monthly mean. To keep the remote reads small, the query samples a single timestep per month — 12:00 UTC on the 15th — and treats that one hourly field as representative of the whole month. It’s a deliberate cost/accuracy trade-off and a real source of scatter in the residuals (alongside the ERA5-vs-ERSSTv5 dataset difference).

Where I’d love feedback:

  1. The sampling shortcut — is one timestep/month defensible for ONI, or does it bias specific seasons? If you’ve quantified single-sample vs. full-monthly-mean error on ERA5 SST, I’d love to hear it.
  2. Climatology handling — I reproduced NOAA CPC’s centred, rolling 30-year base-period schedule; curious whether others here approximate it differently.
  3. The ERA5↔ERSSTv5 comparison — is ~0.1–0.2 °C the right expectation for that dataset gap, or am I attributing too much of the residual to it?

Full write-up and the runnable SQL/validation/plots below — happy to be told I’ve got something wrong.

References

  1. Blog post (narrative + validation): Computing the El Niño index from ERA5 with SQL · Stratoscale
  2. Cookbook (SQL, comparison script, plots): zarr-datafusion/cookbook/el-nino-oni at main · jayendra13/zarr-datafusion · GitHub
4 Likes

Cool project. And I commend you on trying out an actually complicated metric (rather than a simple reduction) with a different paradigm. There’s lots to learn here.

I like this metric because it clearly points out everything wrong with our analysis stack. Neither your SQL nor my Xarray attempt from many years ago gives me any confidence that either of them strictly matches the definition of ONI. Your SQL version is certainly cleaner in terms of identifying the climatology base periods. I think this aspect of intelligibility is particularly important given how much science code is going to be written by agents. None of this code is meaningfully auditable by the prompting human.


[now I will put on my ~scientist hat~ oceanography life vest].

First, that’s just not a mean period. It’s sampling, whereas a mean is filtering then sampling. Always filter before sampling to avoid aliasing.

The classic example for why this matters is why tires appear to rotate backwards when their speed is fast enough (relative to the sampling camera, or your eye). Put simply, if you are sampling a signal that has a peak at frequency higher than sampling frequency, you will alias that peak to a lower frequency. here the camera is sampling too slow for the speed of the wheel. Wagon-wheel effect - Wikipedia . If you took this at face value, your inference of wheel rotation direction would be totally wrong.

Why Do Wheels Look Like They Rotate Backwards At A Certain Speed? |  CarThrottle

So the way to do that approximation “right” is to filter to a frequency less than monthly (i.e. 3 monthly) and then sample it at monthly. (remember the mean is a boxcar filter + sampler combined). Though I don’t see why you need it in the first place.


The sampling shortcut — is one timestep/month defensible for ONI, or does it bias specific seasons? If you’ve quantified single-sample vs. full-monthly-mean error on ERA5 SST, I’d love to hear it.

A more interesting question is why despite what should be a pretty serious error, your results compare well with the real ONI metrics. My conclusion is that someone else has filtered for you. So who?

And lo and behold I see you’re using ERA5, which is an atmospheric model that I think uses a prescribed SST field as a boundary condition. Presumably this has been smoothed so much already; and you’re averaging over the big box and applying other averages — all of these conspire to basically filter out most sub-monthly variability so that your sampling approach mostly works.

[edit] That field cannot be “too wrong” since it’s basically repackaged observations that feed in to the “real ONI” and the model isn’t evolving it dynamically.

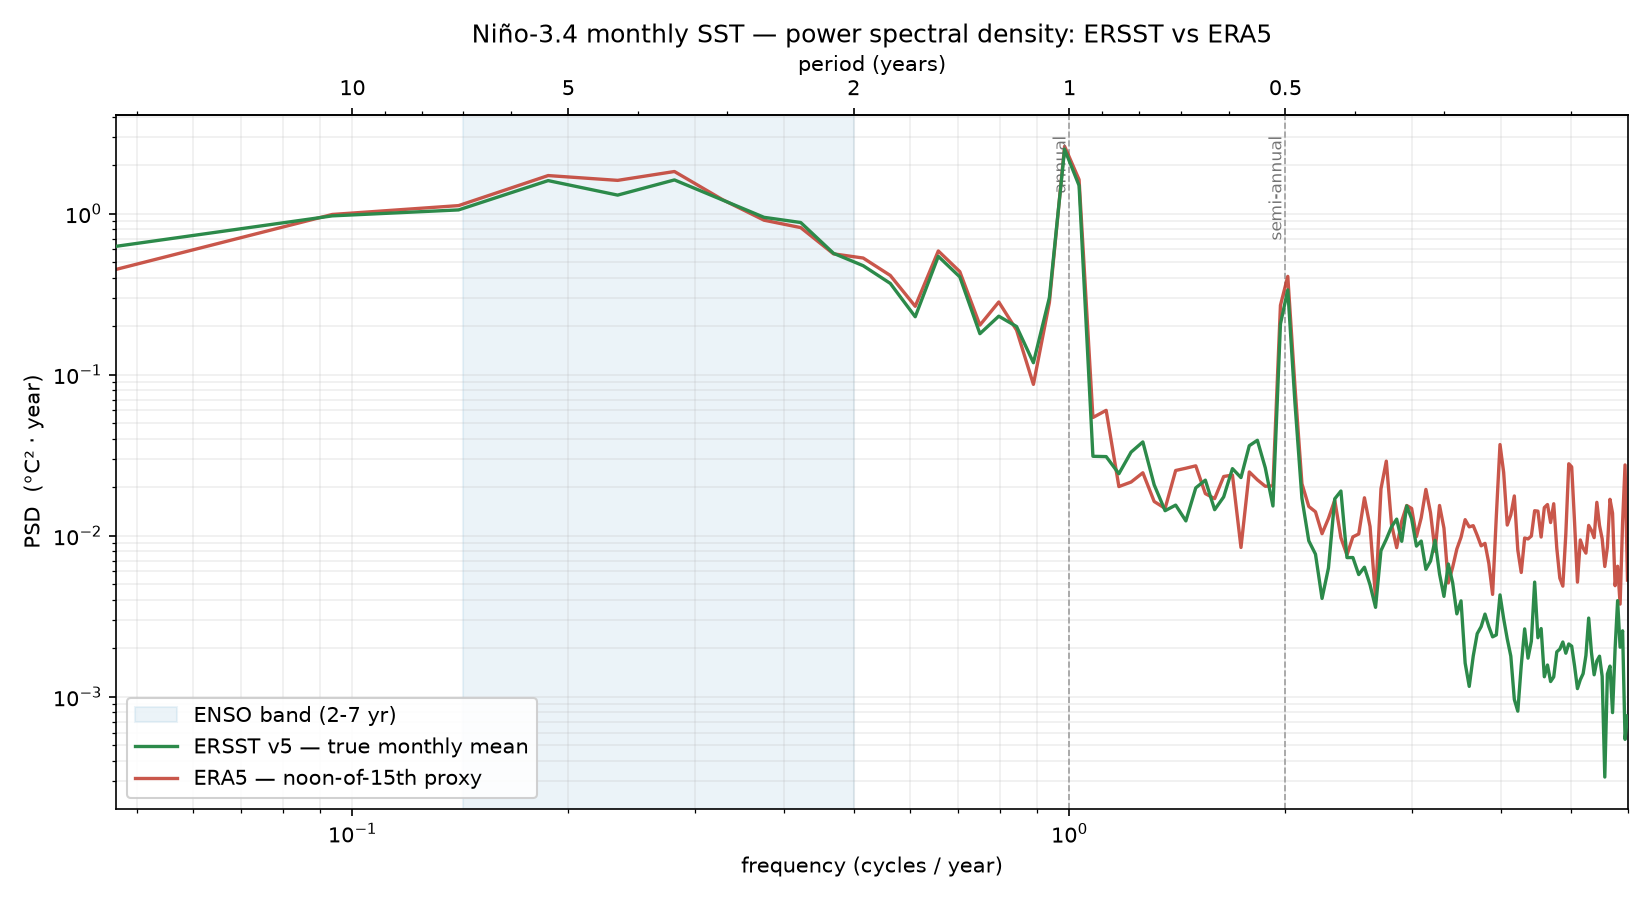
You can check this assertion by comparing the power spectral density between ERA5 and ERSST.v5 (used for the real metric) for the box-averaged SST. Or by running your SQL code on ERSST.v5 and comparing to the real one.


PS: Fun fact: the Earth System has many extremely strong peaks (solar and lunar tides for example), and satellite orbits have to be carefully designed to avoid aliasing them in to “important parts” of the spectrum for scientific analysis. Aliasing is inevitable in most cases, so you design the orbit so it doesn’t corrupt the scientific mission (that’s my understanding in any case).

4 Likes

Thanks, this is a great response.

The high correlation surprised me too, given how crude the sampling is, but your explanation helps to understand it: SST goes into ERA5 as a smoothed boundary condition, not something the model evolves dynamically, so the sub-monthly variability that would’ve bitten me is already gone. Someone filtered it for me.

The Nyquist framing is a useful takeaway. It’s a good way to see why the shortcut is wrong, even when it happens to work.

Full-monthly-mean recompute, and a run against ERSSTv5 are next up. The ERA5-vs-ERSSTv5 PSD comparison is a fun idea, too.

1 Like

I ran both things you suggested:

  • Same SQL, but on ERSST v5 (what NOAA actually builds ONI from): reproduces the official ONI to MAE 0.001 °C. So the method + engine are validated on the reference product itself, no ERA5 sampling involved. (ERSST is NetCDF — I didn’t convert it, just built a little VirtualiZarr reference and read byte-ranges out of NOAA’s file over HTTP.)
  • PSD of the box-averaged SST: the two agree to ~7% in the ENSO and annual bands; ERA5 only runs ~1.64× hotter in the high-freq floor (2–8-month stuff) — exactly the aliased sub-monthly noise you’d expect, and it’s tiny and nowhere near the ONI band.

One honest caveat: PSD mixes two things — sampling (one hour vs a real mean) and dataset (0.25° vs 2°). The clean test is ERA5-vs-ERA5, all-hours mean vs noon-15th, but that’s ~720× the data, and my single-node scan can’t chew through it yet, so it’s parked until distributed mode is up.

Bigger picture, this ONI thing is really a testbed for the project (zarr-datafusion — SQL straight over Zarr/NetCDF, no conversion). Hunting for more examples to stress it; climatology and something WeatherBench-ish are next. If you’ve got a dataset/query/use cases that’d break it, I would love to try them.


Ref: zarr-datafusion/cookbook/el-nino-oni/README.md at main · jayendra13/zarr-datafusion · GitHub

1 Like